
Graphs of Motion
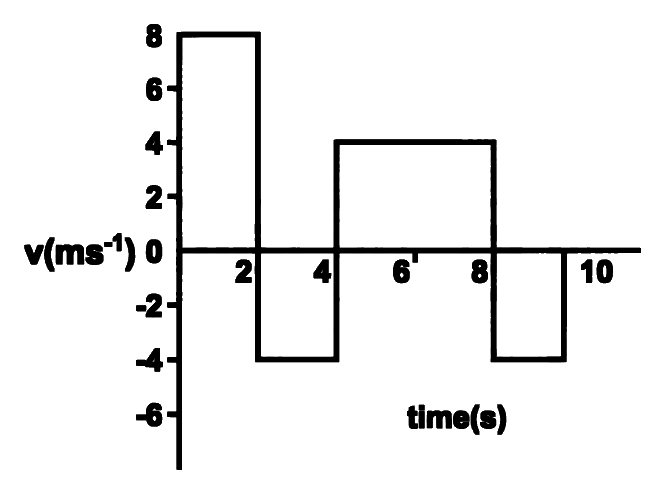
The velocity time graph of a body moving in a straight line is shown in a figure. The ratio of displacement to distance travelled by the body in time to s is
Show answer and solution
Answer: (d)
Loading the solution…
Home›Practice Hub›Chapters›Motion in One Dimension›Graphs of Motion
Motion in One Dimension PYQs · MHT CET · JEE Main · NEET
Graphs of Motion
The velocity time graph of a body moving in a straight line is shown in a figure. The ratio of displacement to distance travelled by the body in time to s is
Answer: (d)
Graphs of Motion
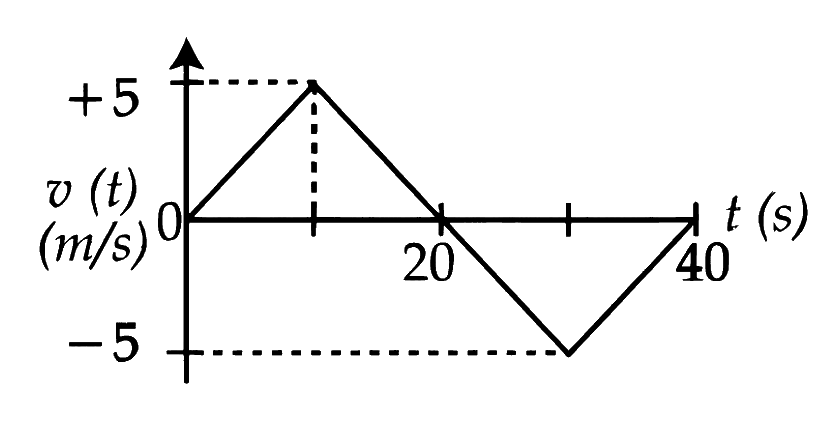
The velocity versus time plot of a particle is shown in the figure, for a time interval of 40 s. The total distance travelled by the particle and the average velocity during this period are, respectively
______.
Answer: (c)
Graphs of Motion
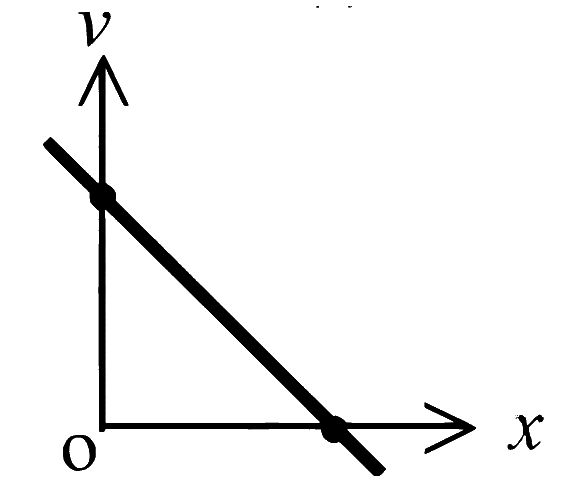
The velocity - Distance graph is shown in figure. Which graph represents acceleration(a) versus distance ( ) variation of this system?
Answer: (d)
Graphs of Motion
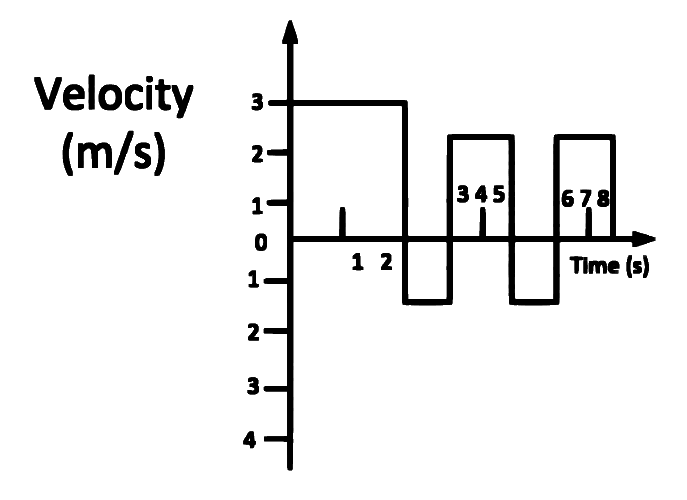
The velocity time graph of a body moving in a straight line is shown in figure. The ratio of displacement to distance travelled by the body in time 0 to 8 s is
Answer: (c)
Graphs of Motion
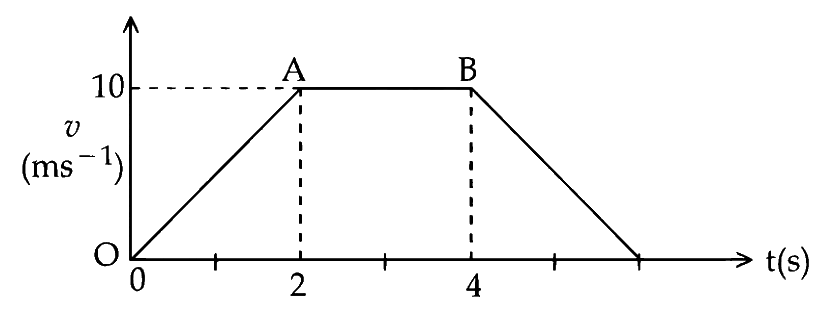
The velocity-time graph of an object moving along a straight line is shown in the figure. What is the distance covered by the object between to ?
Answer: (b)
Graphs of Motion
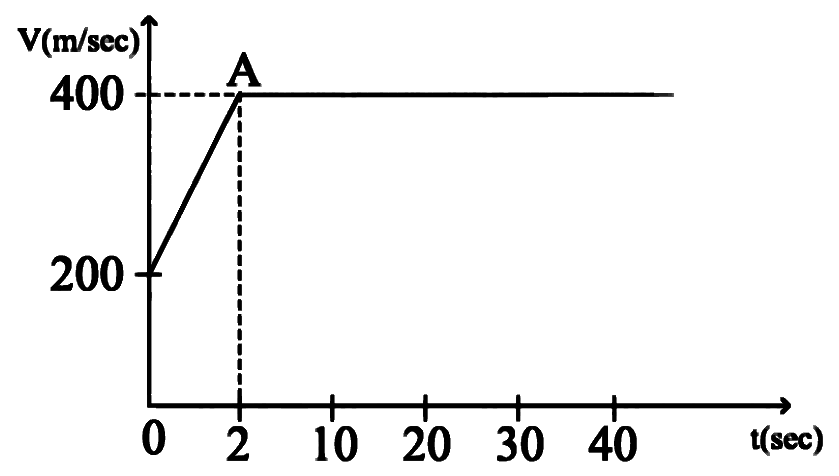
The motion of an airplane is represented by velocity-time graph as shown below. The distance covered by airplane in the first 30.5 second is ̱_______ km.
Answer: (a)
Graphs of Motion
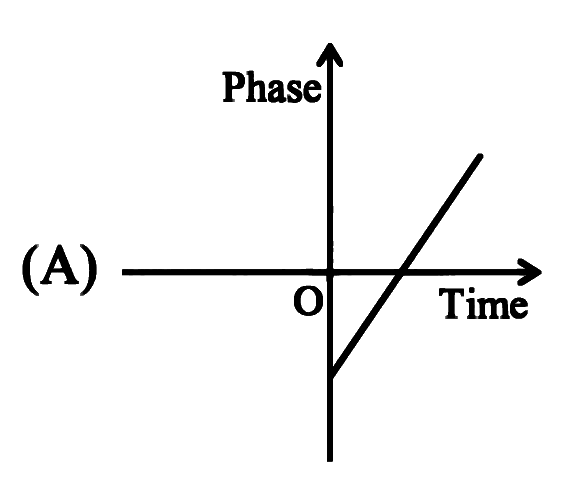
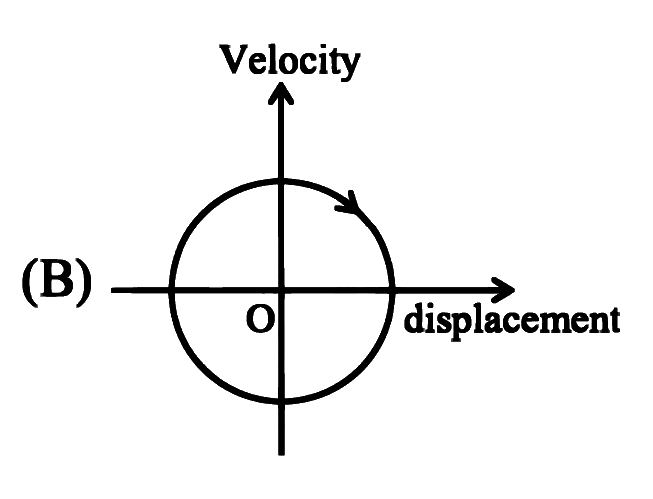
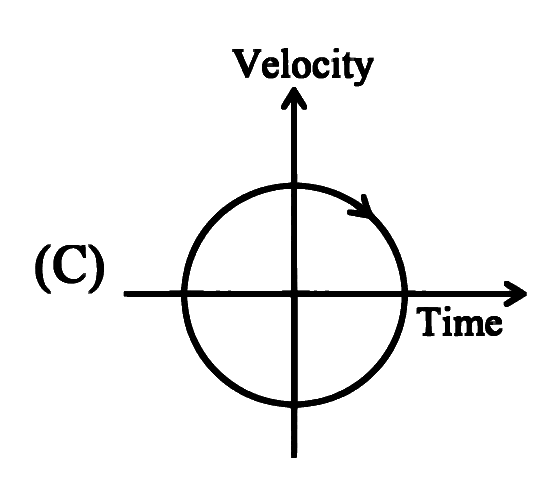
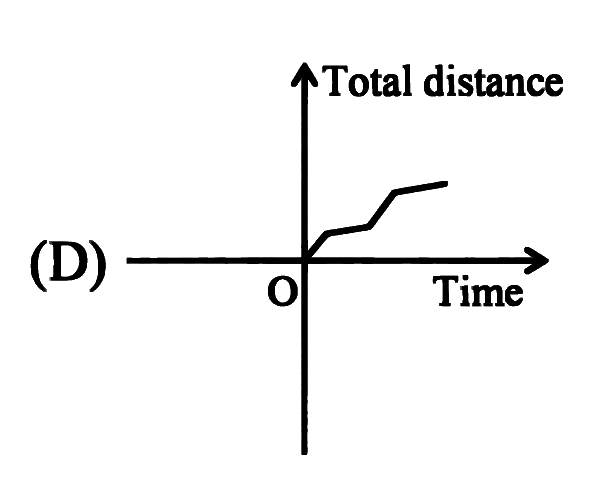
Which of the following curves possibly represent one-dimensional motion of a particle?
Choose the correct answer from the options given below:
 |  |
 |  |
Answer: (c)
Graphs of Motion
The displacement x versus time graph is shown below.
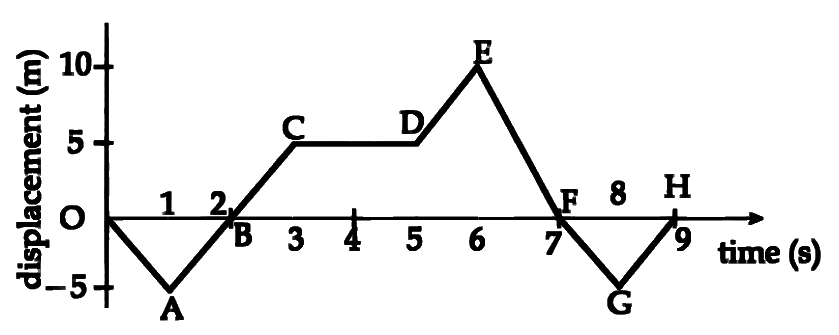
(A) The average velocity during 0 to 3 s is
(B) The average velocity during 3 to 5 s is
(C) The instantaneous velocity at is
(D) The average velocity during 5 to 7 s and instantaneous velocity at are equal (E) The average velocity from to is zero
Choose the correct answer from the options given below:
Answer: (d)
Graphs of Motion
The acceleration (a) - time (T) graph for the body starting from rest is given below. The maximum speed of the body is
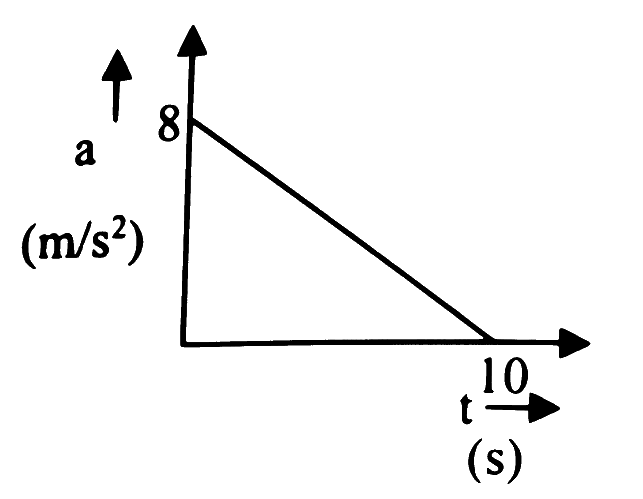
Answer: (a)
Graphs of Motion
The following figures show the variation of displacement with time of a particular object.
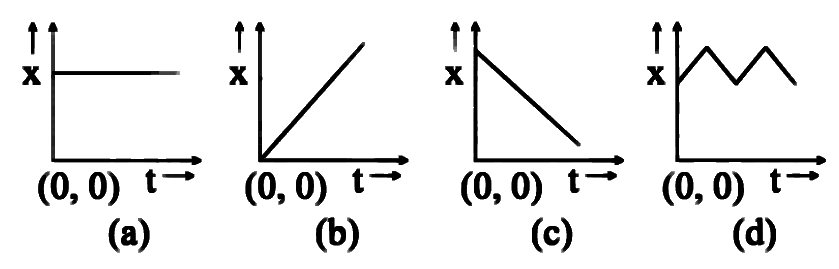
Answer: (a)
Graphs of Motion
For the velocity-time graph shown in the figure below, the distance covered by the body in last two second of its motion is ' '. What is the ratio of ' ' to the total distance covered by it
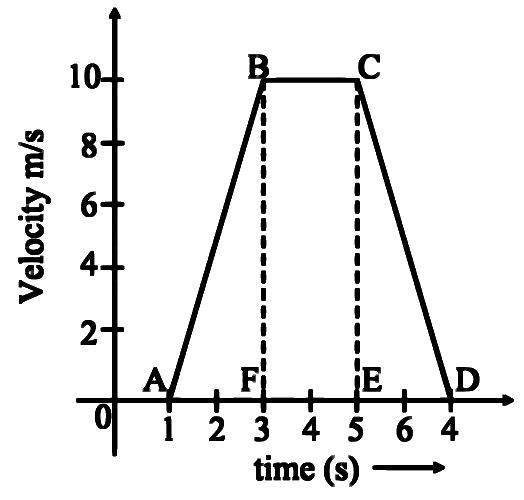
Answer: (b)
Graphs of Motion
A velocity - time graph of a body is shown below. The distance covered by the body from 6 second to 9 second is
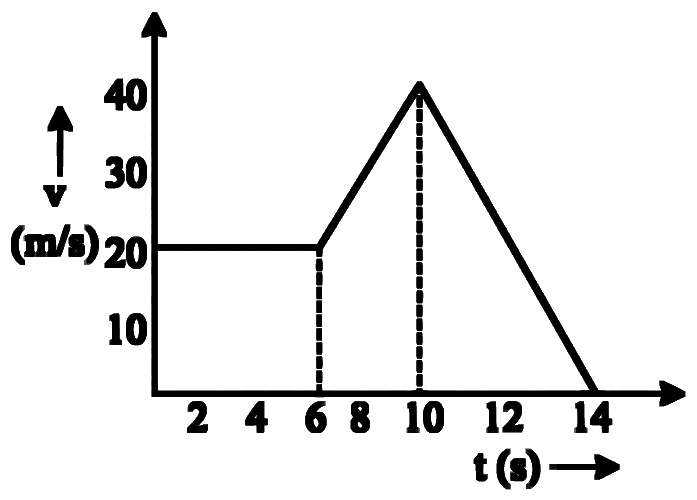
Answer: (c)
Graphs of Motion
The acceleration of a moving body can be found from
Answer: (c)
Graphs of Motion
The velocity time plot of the motion of a body is shown below:
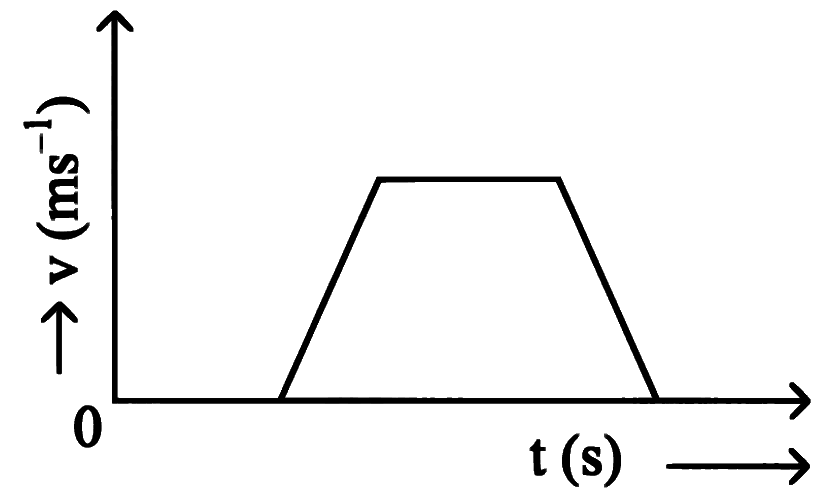
The acceleration time graph that best suits this motion is:
Answer: (c)
Graphs of Motion
The position-time graphs for two students A and B returning from the school to their homes are shown in figure.
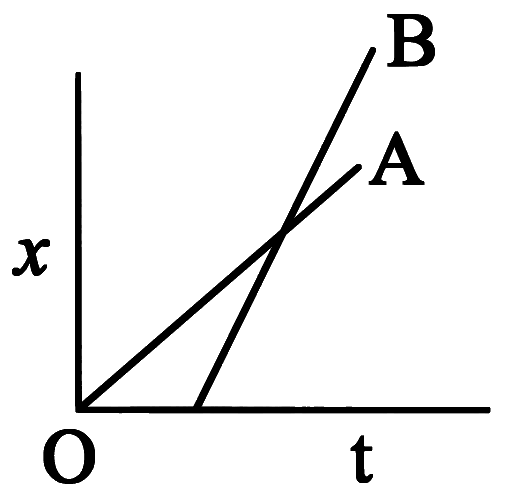
(A) A lives closer to the school
(B) B lives closer to the school
(C) A takes lesser time to reach home
(D) A travels faster than B
(E) B travels faster than A
Choose the correct answer from the options given below:
Answer: (b)
Graphs of Motion
From the graph shown, the ratio of distance to displacement in of motion is:
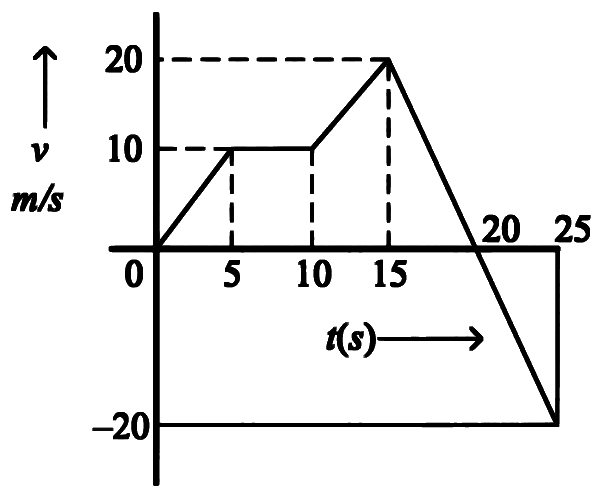
Answer: (d)
Graphs of Motion
The velocity time graph of a body moving in a straight line is shown in the figure.
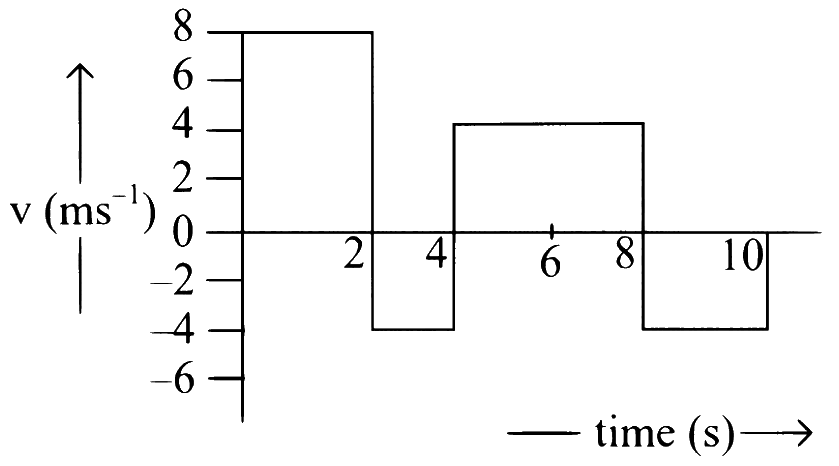
The ratio of displacement to distance travelled by the body in time 0 to 10s is:
Answer: (b)
Graphs of Motion
Given below are two statements
Statement I: Area under velocity- time graph gives the distance travelled by the body in a given time. Statement II: Area under acceleration- time graph is equal to the change in velocity in the given time.
In the light of given statements, choose the correct answer from the options given below.
Answer: (c)
Graphs of Motion
Match Column-I with Column-II:
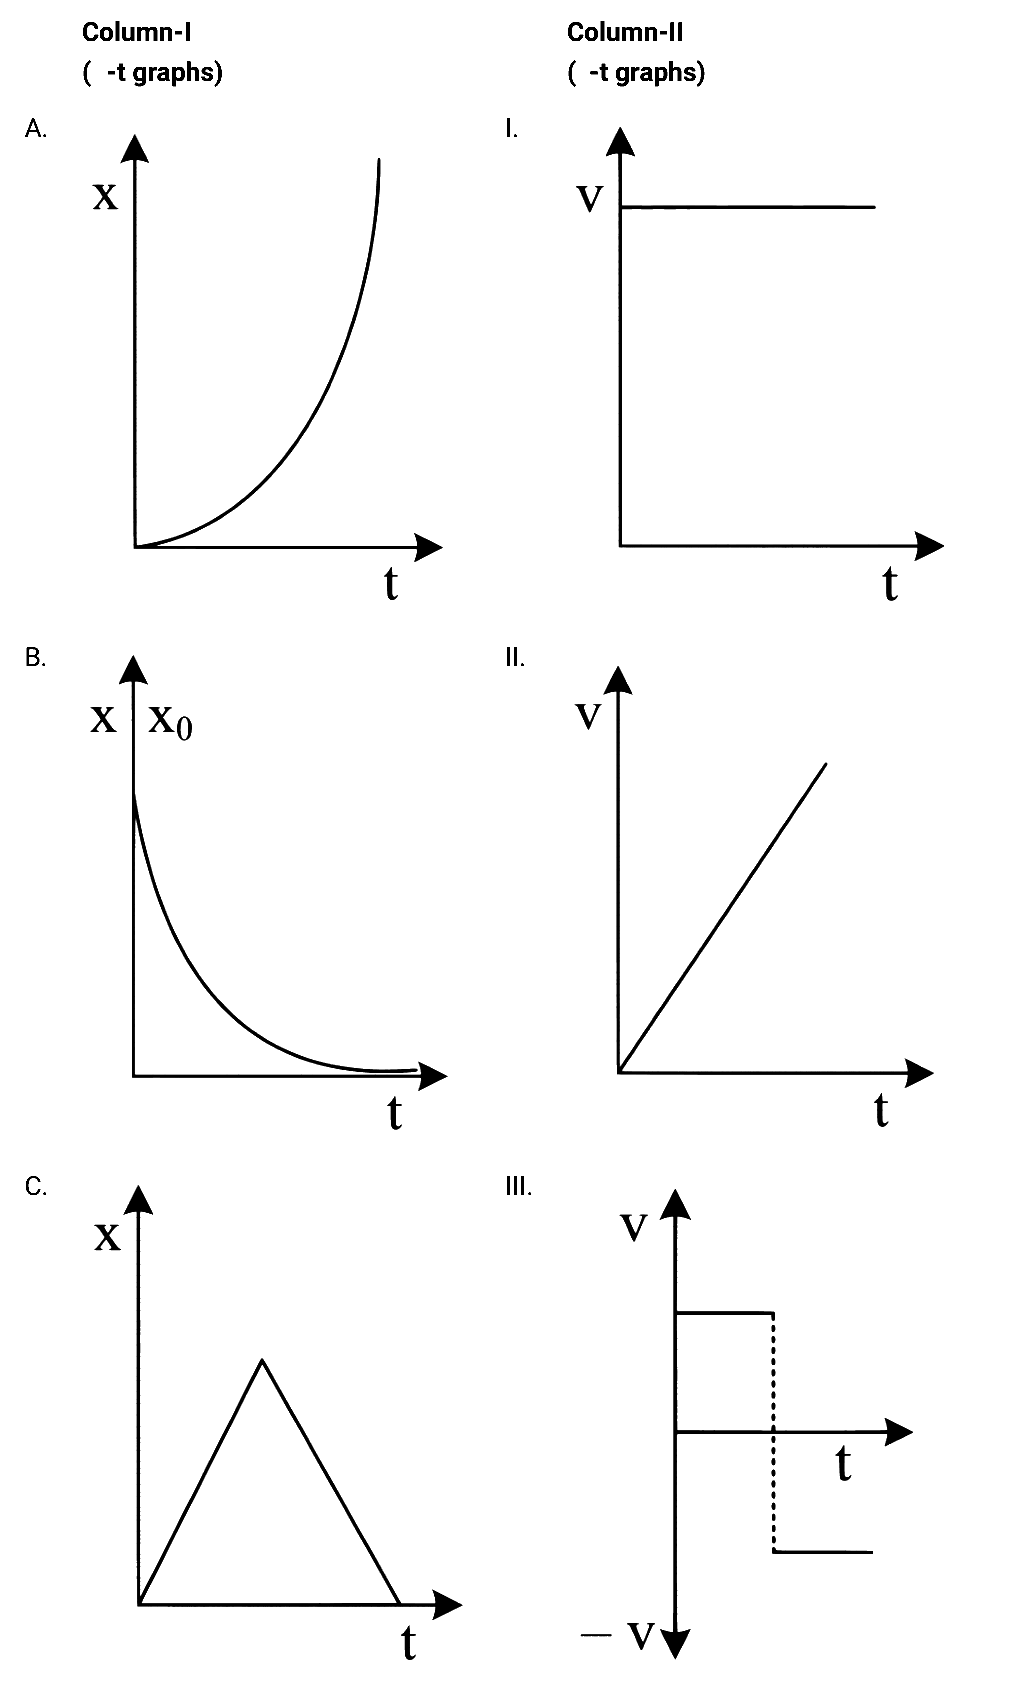
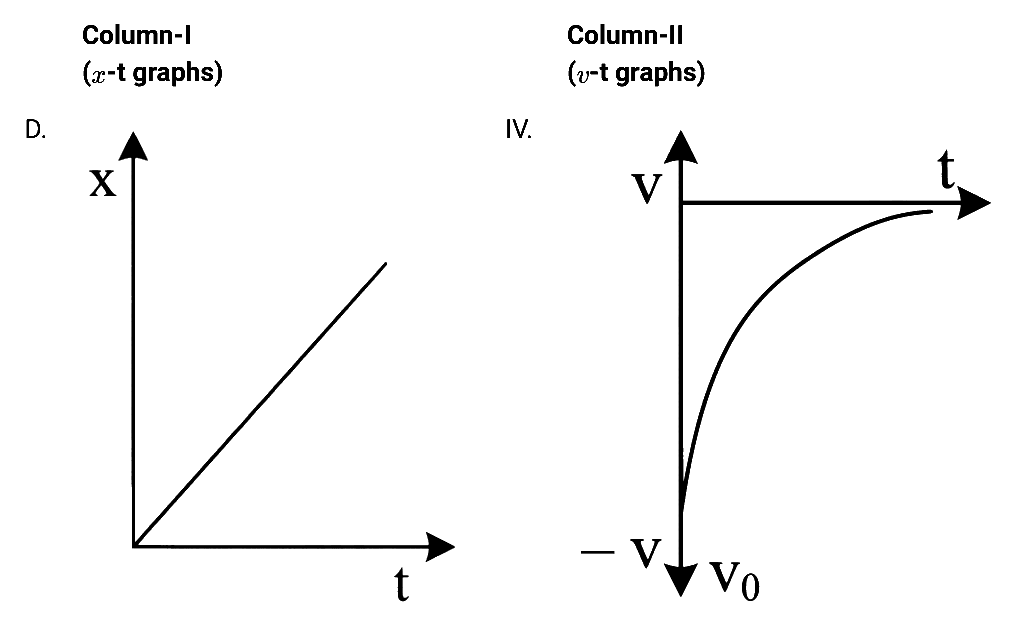
Choose the correct answer from the options given below:
Answer: (b)
Graphs of Motion
The position-time (x - t) graph for positive acceleration is
Answer: (b)
Graphs of Motion
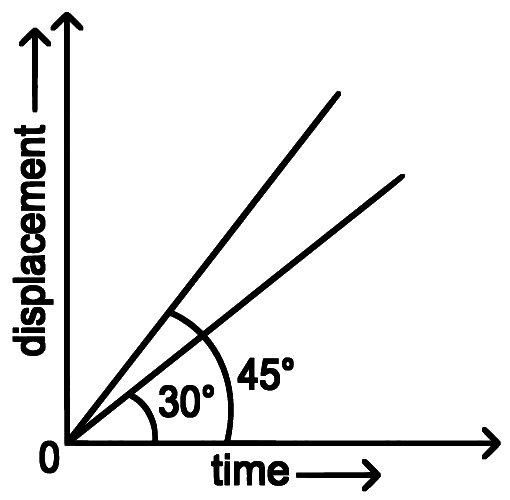
The displacement-time graphs of two moving particles make angles of 30 and 45 with the x-axis as shown in the figure. The ratio of their respective velocity is
Answer: (d)
Graphs of Motion
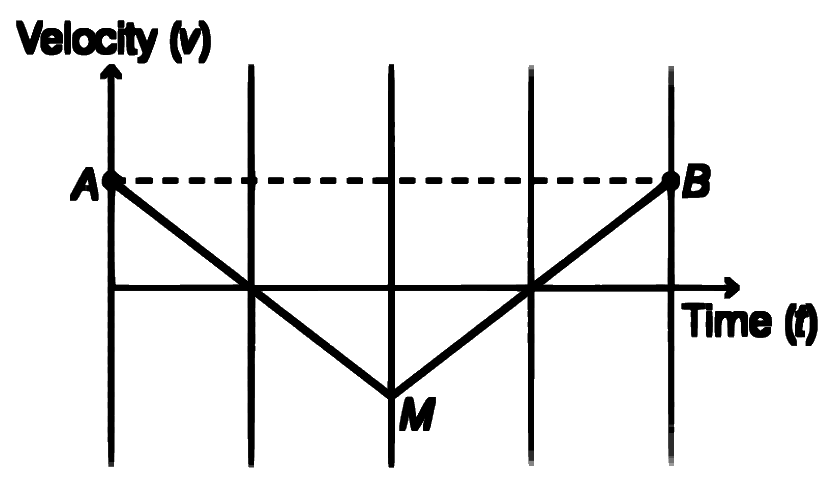
If the velocity-time graph has the shape AMB, what would be the shape of the corresponding acceleration-time graph?
Answer: (c)
Graphs of Motion
The position, velocity and acceleration of a particle moving with a constant acceleration can be represented by:
Answer: (b)
Graphs of Motion
A particle is moving with constant acceleration 'a'. Following graph shows v2 versus x(displacement) plot. The acceleration of the particle is ___________ m/s2.
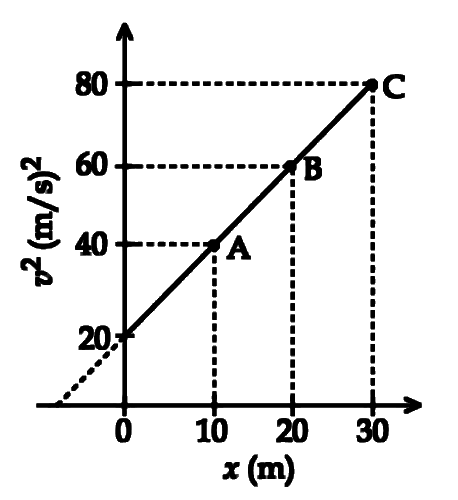
Numerical answer type. Work it out, then open the answer.
Answer: 1
Graphs of Motion
The velocity displacement graph of a particle is shown in the figure.
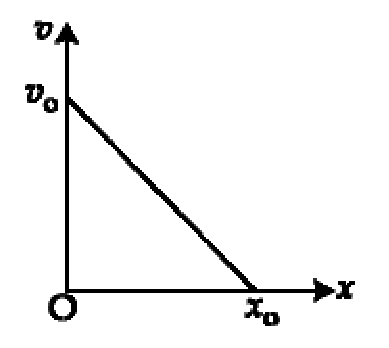
The acceleration displacement graph of the same particle is represented by:
Answer: (a)
Graphs of Motion
The velocity-displacement graph describing the motion of bicycle is shown in the figure.
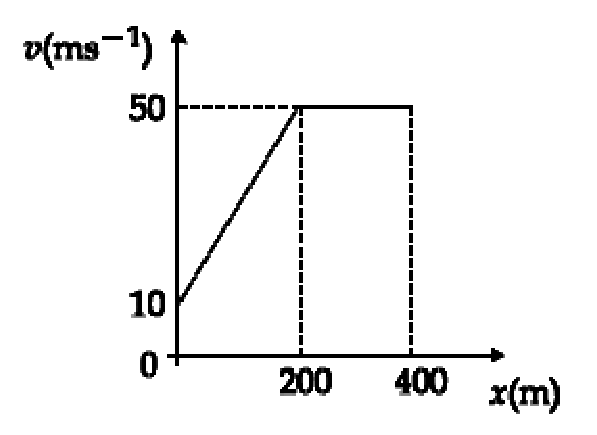
The acceleration-displacement graph of the bicycle's motion is best described by:
Answer: (a)
Graphs of Motion
The speed versus time graph for a particle is shown in the figure. The distance travelled (in m) by the particle during the time interval t = 0 to t = 5 s will be________.
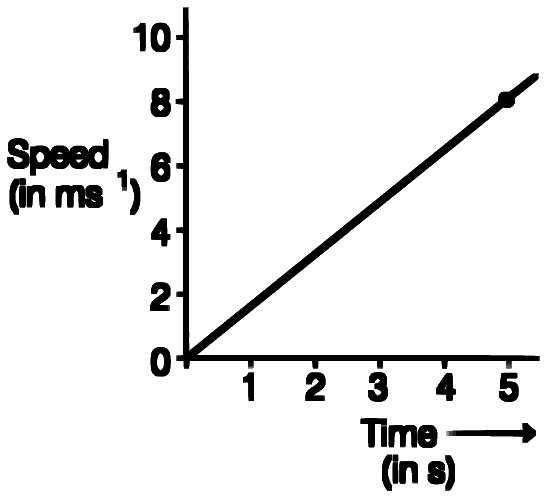
Numerical answer type. Work it out, then open the answer.
Answer: 20
Graphs of Motion
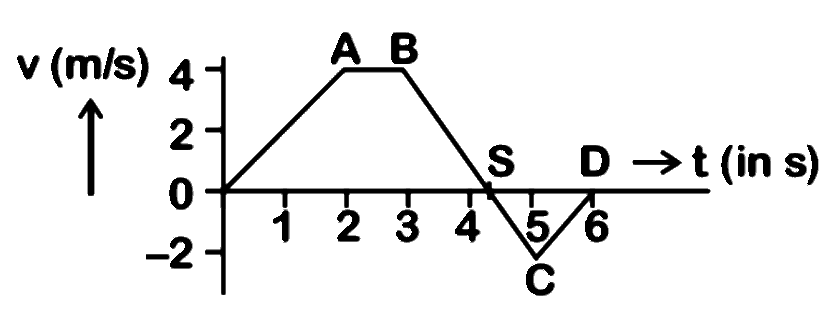
The velocity (v) and time (t) graph of a body in a straight line motion is shown in the figure. The point S is at 4.333 seconds. The total distance covered by the body in 6 s is:
Answer: (d)
Graphs of Motion
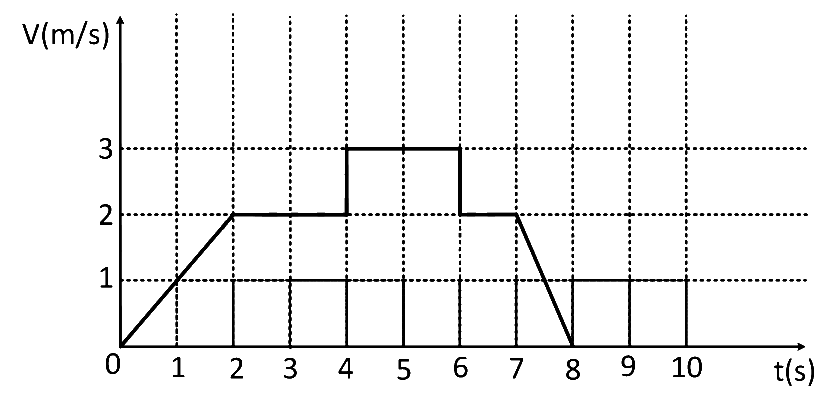
A particle starts from the origin at time t = 0 and moves along the positive x-axis. The graph of velocity with respect to time is shown in figure. What is the position of the particle at time t = 5s?
Answer: (b)
Graphs of Motion
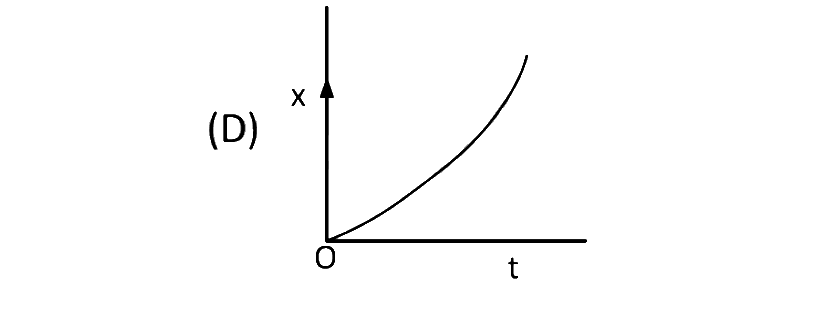
A particle starts from origin O from rest and moves with a uniform acceleration along the positive x- axis. Identify all figures that correctly represent the motion qualitatively. (a = acceleration, v = velocity, x = displacement, t = time)
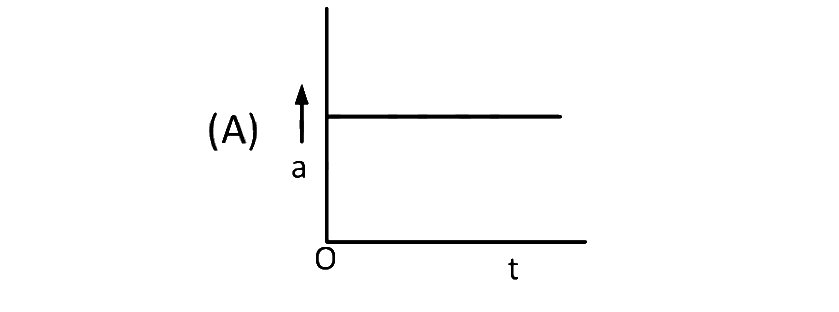 |
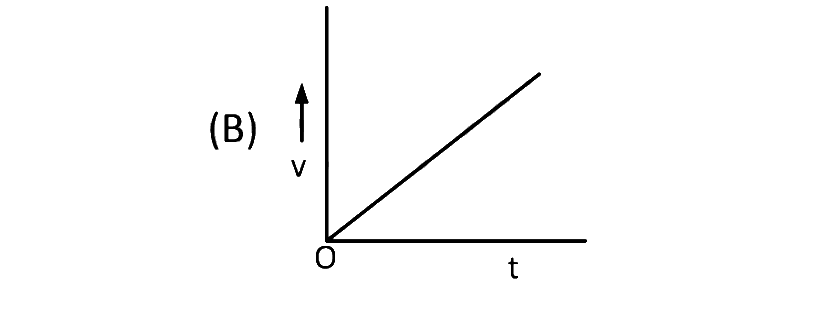 |
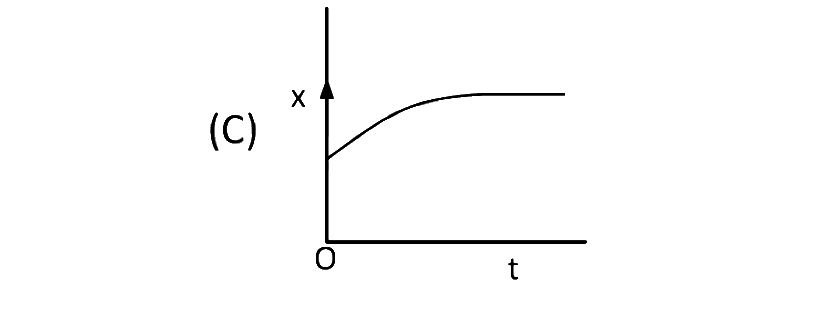 |
 |
Answer: (d)
Graphs of Motion
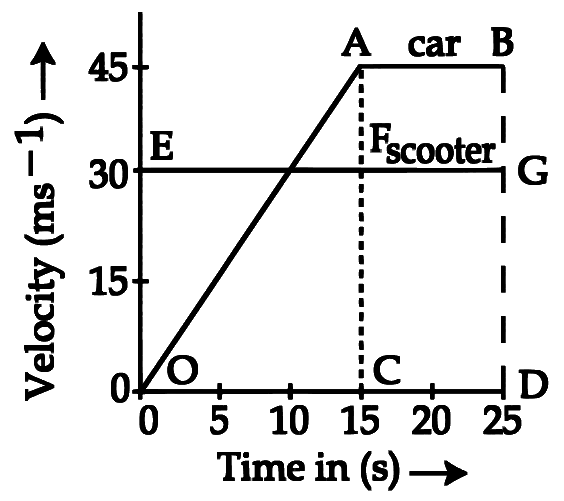
The velocity-time graphs of a car and a scooter are shown in the figure. (i) The difference between the distance travelled by the car and the scooter in and (ii) the time at which the car will catch up with the scooter are, respectively.
Answer: (a)
Graphs of Motion
All the graphs below are intended to represent the same motion. One of them does it incorrectly. Pick it up.
Answer: (c)
Graphs of Motion
Which graph corresponds to an object moving with a constant negative acceleration and a positive velocity?
Answer: (c)
Graphs of Motion
A body is at rest at At it starts moving in the positive -direction with a constant acceleration. At the same instant another body passes through moving in the positive direction with a constant speed. The position of the first body is given by after time and that of the second body by after the same time interval. Which of the following graphs correctly describes as a function of time ?
Answer: (b)
Graphs of Motion
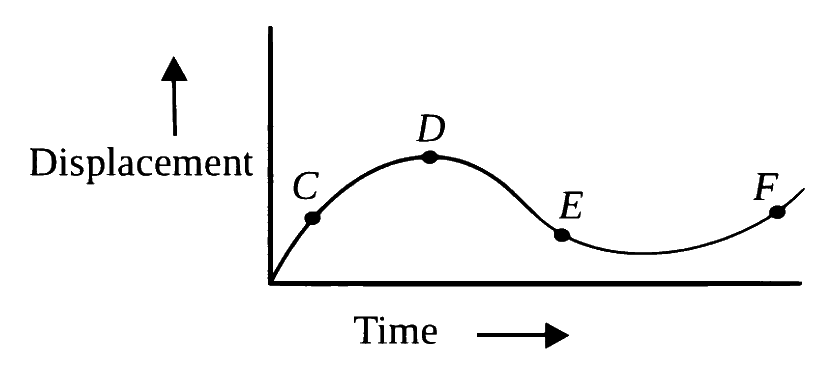
The displacement-time graph of a moving particle is shown below. The instantaneous velocity of the particle is negative at the point
Answer: (a)
Graphs of Motion
Which of the following curve does not represent motion in one dimension?
Answer: (b)
No questions match these filters.